An introduction to PyRQP
Introduction to PyRQP, an open source version of the Environment Agency's River Quality Planning software written in Python.
I have written an open source version of the Environment Agency’s River Quality Planning (RQP) software in Python
Please feel free to check the repository at https://github.com/PauJuan/PyRQP
In this post I will discuss what RQP is, some fundamentals on how it works and provide an example to use it.
RQP
RQP is one of the main tools used for discharge permitting and water management in the UK. The main purpose of the tool is to simulate the mixing of two inputs (generally a river and a discharge) to estimate the distribution of the output concentration of the downstream mixing zone. Typical uses of the tool would be to determine the possible impact of an increased flow discharged at a location, or the quality required at a given discharge to meet a specific water quality standard downstream of the discharge. RQP is the model underpinning the functionality implemented by the Environment Agency’s catchment simulator SIMCAT and UKWIR’s SAGIS.
There are two key points underlying the methodology of the RQP tool:
- The input data are correlated. That is, they are dependent on one another and change together to a certain degree.
- It is possible to simulate the mix of two distributions by using a numerical method such as Monte Carlo (i.e., repeated random sampling to obtain numerical results).
These are explained a continuation.
Correlation
RQP generates four sets of random correlated data based on each parameter’s distributions, which are generally considered to be lognormal. The parameters are: river flow, discharge flow, river concentration and discharge concentration. The following is a graphical representation of what this looks like for river flow and quality. The correlation between river flow and discharge flow is typically 0.6.

Example of river flow and quality correlation of 0.6 for two lognormal distributions. River flow mean and std are 20 and 4.5; river quality mean and std are 4 and 0.9. These values are approximate
Monte Carlo
By applying a simple mass balance, the downstream flow and concentration is calculated. A graphical representation of the Monte Carlo method for mixing distributions is shown below.
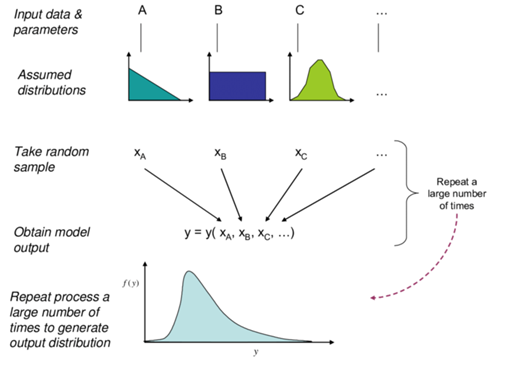
Monte Carlo sampling method
Source: Henderson, Brent & Bui, Elisabeth. (2005). Determining Uncertainty in Sediment & Nutrient Transport Models for Ecological Risk Assessment. Report No 2. LWA/MDBC Project UMO43: Risk-based Approaches to Managing Contaminants in Catchments. CSIRO.
Installation
The PyRQP package is available for installation using PyPI:
pip install PyRQP
However, the pip version may lag behind the release version. For the moment I recommend to clone (or simply download) the repository from GitHub and run it directly by using the example notebooks. It is possible to open and run the notebooks using ArcGIS Pro (where SAGIS is usually run) with no need to install any dependencies.
Examples
The main library and all its functions can be used calling:
import rqp
The following notebook shows a full example of how to use RQP for one case study. The repository contains several notebooks with examples on how to use the library. In my next post I will show how to run RQP in batch using an Excel file.
Thanks for reading. If you end up using this library please feel free to drop me an email and let me know. I am happy to provide support where I can.